Features

System PerformanceMonitoring Solutions

Gain total visibility into your computer's health with our real-time performance tracking tools, designed to identify bottlenecks and optimize system responsiveness.

Real-Time Engine
Automated Balance
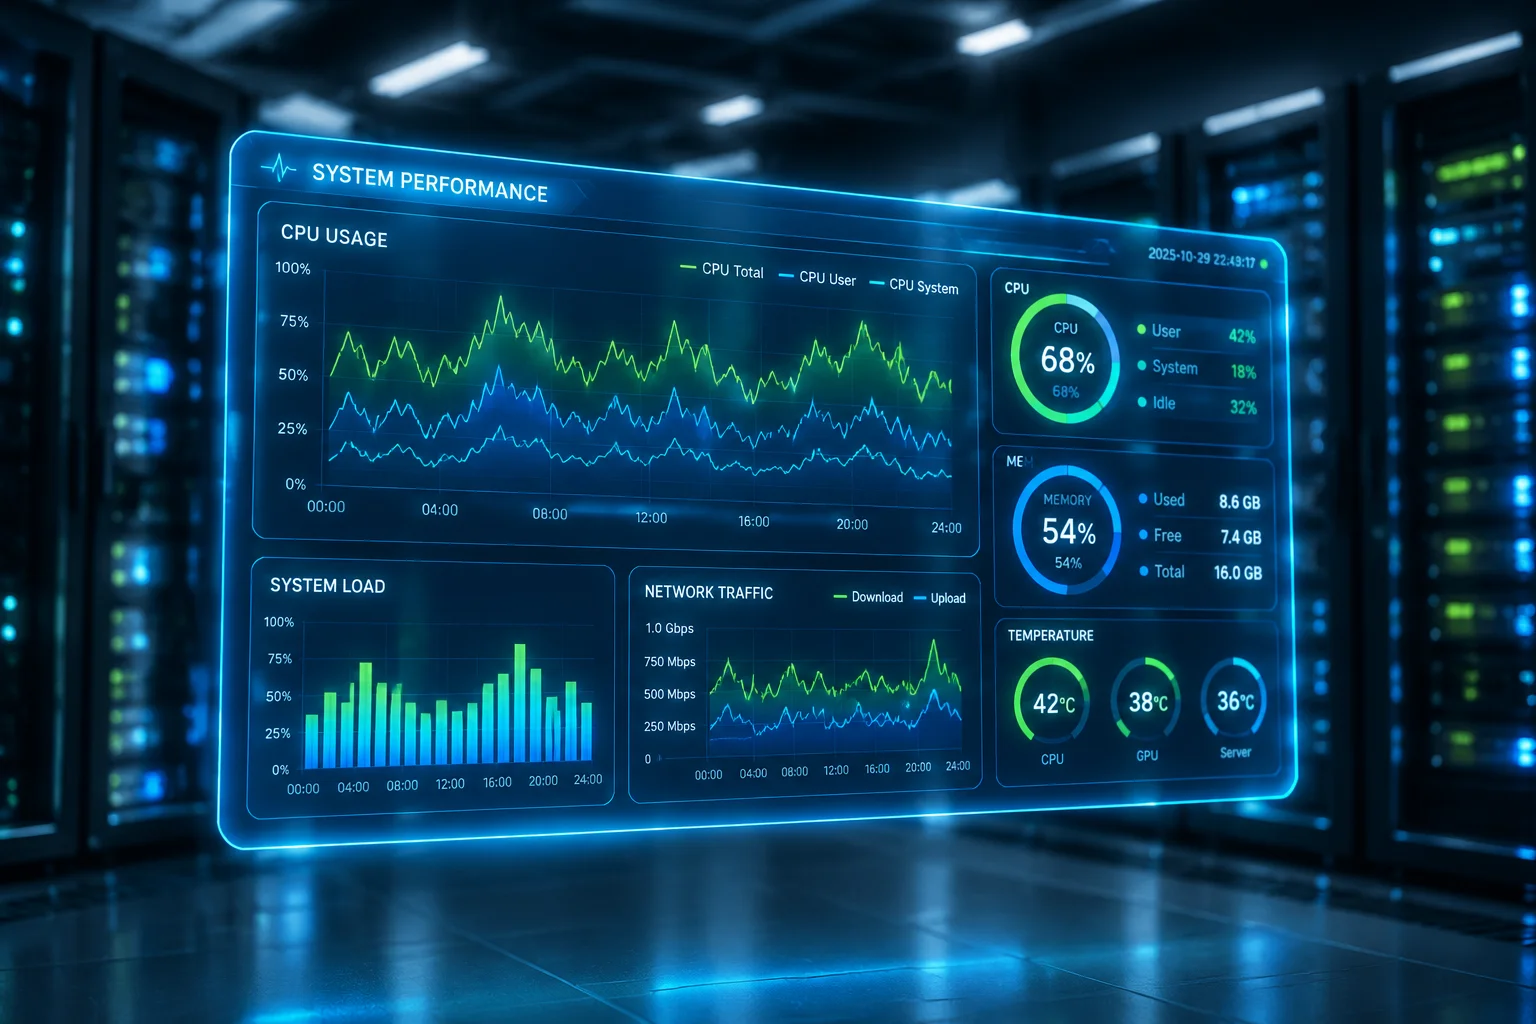
System Performance Monitoring overview display
Advanced Analytics

Real-Time System Insights

Latency: 0.1msStatus: ActiveMonitoring: 24/7Precision: High

Our monitoring system continuously polls your hardware, aggregating data into a user-friendly dashboard. It detects abnormal resource consumption patterns before they result in system-wide sluggishness or crashes.

By tracking CPU clock speeds, RAM usage intervals, and disk read/write throughput, our software builds an accurate profile of your specific workload demands, allowing for dynamic adjustments.

Predictive hardware failure analysis
Multi-process thermal monitoring
Background resource usage tracking
System Performance Monitoring configuration diagram
Optimize Today

Ready for Peak Performance?

Discover the full suite of optimization tools included in our professional software package.

Technical Capabilities

In-Depth System Monitoring

Detailed view of the core modules driving system stability and performance efficiency.

Track core-specific utilization rates and voltage fluctuations in real-time to ensure your processor remains within optimal operating temperatures.

Sample Rate: 10ms Precision: 0.01%

Monitor active page file usage and physical RAM distribution to identify memory leaks or inefficient application caching cycles.

RAM Types: DDR4/DDR5 Latency: Low

Real-time monitoring of IOPS and transfer speeds across your SSDs and HDDs, providing alerts for failing sectors or high-latency read operations.

History: 30 Days Verification: Yes

Check system file consistency and registry integrity to prevent minor performance side-effects from becoming critical OS issues.

Validation: Weekly Status: Stable

Configurable temperature ceilings for CPU, GPU, and NVMe controllers trigger instant alerts before throttling begins, letting users react to cooling problems instead of discovering them as sudden slowdowns.

Sensors: CPU, GPU & NVMe Response: Instant Notification

Per-process disk queue depth is sampled at fine resolution to reveal which application actually saturates the drive, replacing guesswork with ranked bottleneck reports during heavy copy or sync operations.

Granularity: Per-Process Queue Resolution: 5ms Samples

The monitor correlates session uptime with memory creep, handle counts, and service restarts to produce a daily digest showing whether the system is aging cleanly or accumulating stability debt.

Interval: Daily Digest Metrics: 40+ Indicators